
ARES-100 can serve as an accessory to a Sound Level Meter (SLM), providing measurement of directional bearings to acoustic events. This information increases the dimensionality of noise signatures, improving the confidence of autonomously characterized sound events.
ARES can be set to send bearing results to either the RS232, USB, or BLE (wireless Bluetooth) interfaces, one or more of which are supported by most modern SLMs. This note describes the measurement process that an ARES node employs, and how to use the computed bearings in conjunction with a sound level meter.
ARES samples four measurements (pressure, and triaxial acceleration) at a 4800 Hz rate. The sampled data is time windowed using a Hann window prior to performing a Short-Time Fourier Transform (STFT) on the data, using a 192 sample block size. The time record length is thus 40 msec, but since the FFT results are overlapped in time by 50%, the output of the FFT processing stage provides 50 updates per second. The frequency resolution per FFT bin is 4800/192 = 25 Hz. FFT spectra are A-weighted prior to computing acoustic intensity. The noise floor of the ARES-100 accelerometer is 22 mg/sqrt(Hz), such that after integration of acceleration to compute particle velocity, bins ³100 Hz provide valid measurement results, up to the rated 2 kHz bandwidth for the ARES-100 sensor (bins 4-80).
Triaxial intensity (both active and reactive), the azimuth (theta), and the elevation (phi) are computed for every frequency bin (Figure 2). A bearing histogram collects the results per selected event time window by incrementing the measured active intensity per angular bin, per time step. At the end of the time window (which is
an integral number of 20 msec processing intervals), one or more noise events are chosen from the maximum histogram outputs.

Figure 1 shows an emplacement of ARES-100 near downtown Seattle, 25 km downrange from Sea-Tac airport. The sensor is observing repeated flights over the city after takeoff, as depicted in the spectrograms of Figs 3 and 4.
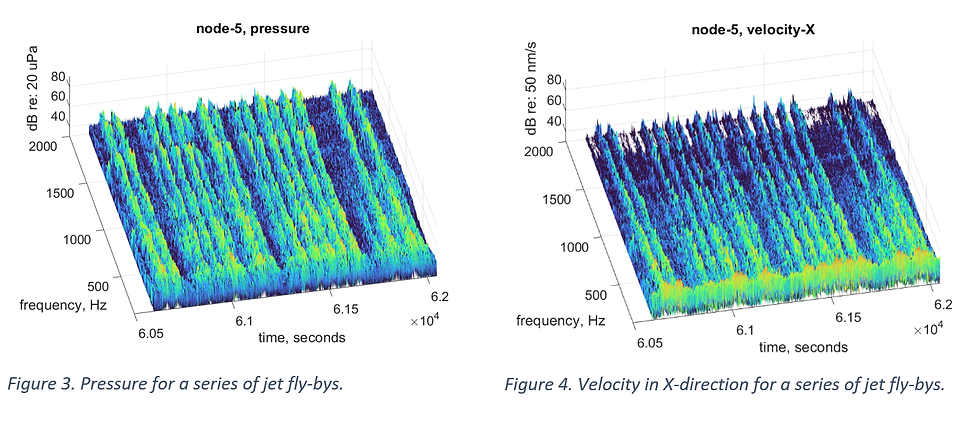
The velocity spectra for the Y and Z channels are not shown. All pressure and velocity spectra are amplitude and phase corrected to have a flat response in the specified 2000 Hz bandwidth, to offset the effects of encasing the sensors in closed cell foam. The foam enhances accelerometer sensitivity and protects the sensor from the weather.
Figure 5 clearly shows several flyover tracks as generated by outputs of the bearing histogram, for an event time window of 200 msec. There is roughly a 50 second interval between jet flyovers of the city (200 seconds per division on the plot). The sensor was oriented such that a westerly direction refers to zero degrees azimuth. Measured azimuths range from -90° (South, from the airport) to about +100° (NNE). Elevations of each fly-by start at near zero, and rise to a maximum of 50° or 60°, in accordance with visual observations. The color of each bearing output represents the signal level in dBA.

Another bearing estimation example is shown in Figure 6. The sensor is mounted on a building roof in an urban environment near other buildings. Two <60 dBA HVAC noise sources are observed at low signal levels throughout the measurement session. The azimuth and elevation of the two HVAC sources vary enough so that these sources are clearly separated in the data. In addition to the two HVAC noise sources, three louder noise events occur. A jet fly-by is present, though it is on the horizon with about zero degrees elevation. Also, later in the dataset a pair of train horn events occur, from a freight train track 3 km distant south of downtown Seattle.
The shaded area in Figure 7 (JSON formatted bearing output of ARES-100) show what the SLM would receive in response to the second train horn event. Though the system is set to detect three sources after every 800 msec event time window, in this case the horn dominates the two lower-level HVAC sources, such that the highest bearing histogram outputs are clustered in an azimuth range from 0 to -30°. While this is not as precise as the Figure 5 jet fly-bys, the horn sound is at a lower level (~65-70 dB) compared to the maximum jet noise (80-85 dB).

Over the aforementioned serial interfaces, ARES-100 nodes output bearing results as JSON formatted strings after every event time window. Time is in POSIX milliseconds, “spl” in dBA. Azimuth and Elevation for one or more detected sources are in degrees relative to accelerometer coordinates. The shaded lines in the example below shows the highest three noise sources per the selected 800 millisecond event time window, for the right-most train horn event shown in the graph on the first page. Pressure (“pres”) is the average over the selected event time window for the maximal angular bin. Each pressure or intensity increment to the angular event histogram can arise from any spectral bin. Please see AIVS Application Note AN-100 for a complete description of the pressure, and active and reactive radial intensity entries in the JSON message.

留言